2018年9月13日雅思小作文参考范文
2018年9月13日雅思考试小作文题目
(国内A类):线图
☟☟☟

本场小作文高分范文
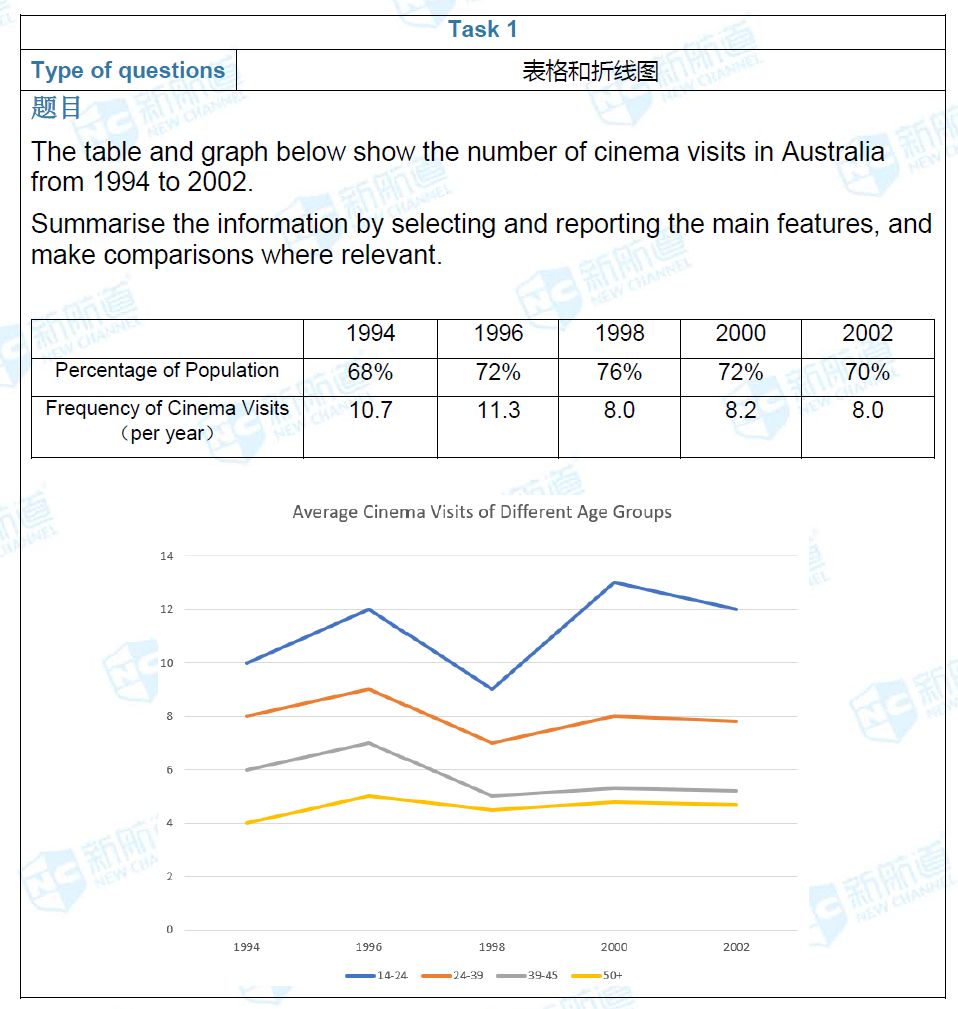
The table presents Australians’ visits to cinemas in 5 separate years, [注意:不是从1994年到2002年,而是分开的5年,这一点注意事项与9月8日的考试一样。] and in the line graph, Australians are divided into 4 age groups, each group’s average [此处为名词,“平均数”] of annual number of visits from 1994 to 2002 is shown.
In terms of the viewers’ proportion out of the whole Australian population, the year of 1998 stands out as the figure – 76 percent [同位语] – in that year was the highest. In the other 4 years, the percentage was within a narrow range of 68 to 72. As for the frequency, the approximate number of 11 times per year in 1994 and 1996 was obviously higher than the ones in the other 3 years.
To view Australians’ cinema visits by age, it [形式主语,指代后面that引导的名词性从句] is clear that [主语从句] the 14-24 group was most likely to watch movies in cinemas. What is also noteworthy is the constant fluctuations – up to 13 times and down to 9 times – during the period. With the increase of age, Australians’ interest in going to the cinema decreased, and the frequency was relatively stable in the three older groups, and it [不是形式主语,而是只带上一句中的主语] is particularly stable in the 50-plus group, where the annual number of visits was around 5.
Overall, variations are rather easy to notice between the years and between the 4 age groups. [不要出现数据,粗线条的概述整个图表,抓整体且突出重点]
雅思写作课程中心
查看更多 >雅思快讯
- 新航道2022年3月19日雅思... 2022-49-29
- 2022年3月19日雅思考试口... 2022-46-29
- Ctrl+C中的ctrl英语是什... 2022-45-29
- 2022雅思考试报名截止日期... 2022-18-06
- 世界上最古老的10所大学,... 2019-32-24


