9月28日雅思小作文题目
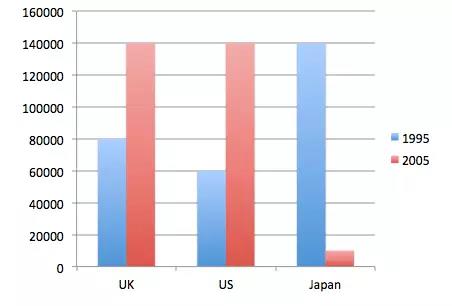
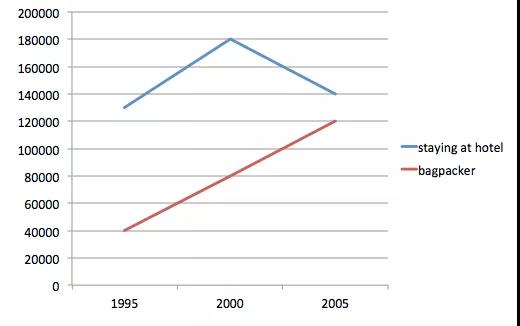
The chart and graph below show the number of tourists from three countries to Australia and two kinds of tourists between 1995 and 2005.


高分范文及解析
组合图的特点:1.一个图复杂,另一个简单;2.两个都简单。
基于学生的习作的修改
黑色字体为学生习作,橘红色字体为老师修改
The bar chart gives information about the numbers of traveling in travelers to Australia from three countries in two separate years, which are 1995 and 2005,and the lines are the illustrations of two different kinds of tourists to Australiafrom 1995 to 2005.
The number of tourists in 1995 is most notable in Japan, It is notable that the number of as Japanese tourists (140,000) ’s number are was the largest amountthat is roughly equal to that of UK tourists and that of US tourists another two groups combined. ←语法现象:主语从句:名词性从句被形式主语it指代。It is also noteworthy that very few Japanese went to Australia was significantly less popular among Japanese tourists in 2005 than in 1995, ←写作法:描述数据所体现出来的事实。 since the number of Japanese tourists which was in 2005, was merely 10,000 ←语法现象:用状语从句引出数字. The number of British visiting Australia rose to 140,000,so were that of American. The year of 2005witnessed that both American tourists and UK tourists were 140,000. ←语法现象:宾语从句:时间为主语 + witness + 在那个时间点上发生的事件。
黄色高亮部分提示:主语的多样性。
The number of tourists in Australia which staying at hotel was volatile during the years. After a surge to the all-time peak high (180,000), it slumped there was a slump to a point (140,000) near the original level. In addition, in terms ofthe number of backpackers, the years 10-year period between 1995 and 2005witnessed the a rapid soaring growth to 120,000, and despite the growth, backpackers were constantly fewer than hotel guests. It is notable that the number of backpacker had always ranked last during the 10 years.
Overall, both the total number of travelers to Australia from the three countries combined and the number of backpackers have increased significantly over the decade.