本文的灵感来源于前段时间有留预阶段的学生要考雅思,分数要求较低--4.5分,没有雅思课程计划,但是对大作文和小作文还不太了解,因此在留预的最后两节课时问我可否给他介绍雅思大作文和小作文的一些基本要求,让学生后期可以有准备的进行复习,因此前我已经历过3次官考,有一些雅思写作方面的备考心得,只要认真备课,是能满足学生的这个需求的,所以就答应了学生。
1.雅思小作文基本情况介绍
①时间:20分钟
②字数:150字以上
③评分标准:Task Achievement--完整切题, Coherence& Cohesion--逻辑性和连贯性, Lexical Resource--用词准确地道, Grammatical Range and Accuracy--句子准确多样
以下为小作文六分的一些特点
TA:能够选择恰当的信息进行概述;呈现并充分强调主要内容/要点,但有时含有不相关\不恰当或不准确的细节信息。
CC:连贯地组织信息及观点,总体来说,能清晰地推进行文发展;有效地使用衔接手段,但句内及/或句间的衔接有时有误或过于机械。
LR:使用足够的词汇开展写作任务;试图使用不常用词汇,但有时使用不准确;在拼写及/或构词方面有错误,但不影响交流。
GRA:综合使用简单句式和复杂句式;在语法及标点符号方面有一些错误,但这些错误很少影响交流。
因此在备考时要关注这四方面的要求。
2.雅思小作文分类
雅思小作文分为数据图和非数据图两大类,其中数据图按大类分为动态图和静态图,非数据图分为流程图和地图。
下文将重点介绍雅思小作文中考试频率非常高的数据图--动态图和静态图,以及这两类小作文的区别,文章框架并提供了两个范文。
雅思小作文数据图分类:动态图和静态图
①静态图(没有时间跨度)
Eg:

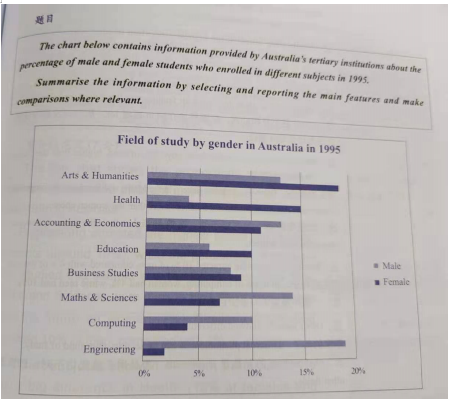
静态图小作文要读的几个方面:题目+图表title+比较对象(上图为male&female)+描述对象(纵轴各学科)
图形解读:图形描述的是澳大利亚1995年高校男生和女生选择不同专业的比例,男比女高的专业有Engineering, Computing, Math& Sciences;女比男高的有Arts& Humanities, Health, Education, 男女差不多的有Accounting & Economics, Business& Studies.
思路提示
1.时态:图表描述的是1995年的比例,可以确定主要时态为一般过去时
2.分段:开头段(题目改写);
主体段1(男比女高);
主体段2(女比男高+差不多比例的);
总阶段(不需要引申,点出最受男生欢迎的专业以及最受女生欢迎的专业,总结一下其他受男女生欢迎的专业)
注意:此文章主体段不适合按性别分段,不好进行各个科目的对比。
范文
The bar chart provided shows the proportions of men and women who studied different university subjects in the year 1995 in Australia.
解读:小作文首段题目改写可以通过换词,改词性或变换句式(如主被动的转换)来进行,下面提供两个句型:The chart provided describes...
Given is the graph which describes...
Engineering attracted the highest proportion of male students(around 19%), while the percentage of females who studied this subject was the lowest( less than 3%). Maths and Sciences were chosen by 13% of men, higher than the figure for women(7%).Similarly, Computing attracted 10% of men, compared with 4& of women.
Other subjects showed different patterns.There was a big difference in Health (15% of females and only 4% of men). While nearly 19% and 10% of female students studied Arts and Humanities and Education, only 13% and 8% of male students chose these subjects. By comparison, the proportion of boys who studied Accounting& Economics was similar to the figure for girls (13% and 11% respectively).
主体段解读:while,by comparison等对上下文进行了很好的衔接,同时也使用了定语从句,状语从句等复杂句,被动语态以及高分搭配和句型如the highest proportion of, There was a big difference in等
Overall, Engineering was the top choice for men, whereas Arts& Humanities were the most popular option for women. Women were more likely than men to study Education, Health and Business Studies, and a different pattern was seen in other subjects.
结尾段解读:概括了主体段的内容,强调了男女各自的选择最多的专业,突出了关键信息,并用非常概括性的语言总结了其他科目。词汇如overall过渡,whereas进行男女对比,be likely to都非常加分。
②动态图(有时间跨度)


动态图与静态图的一大区别是动态图有时间跨度,因此主体段要对不同时间进行对比。
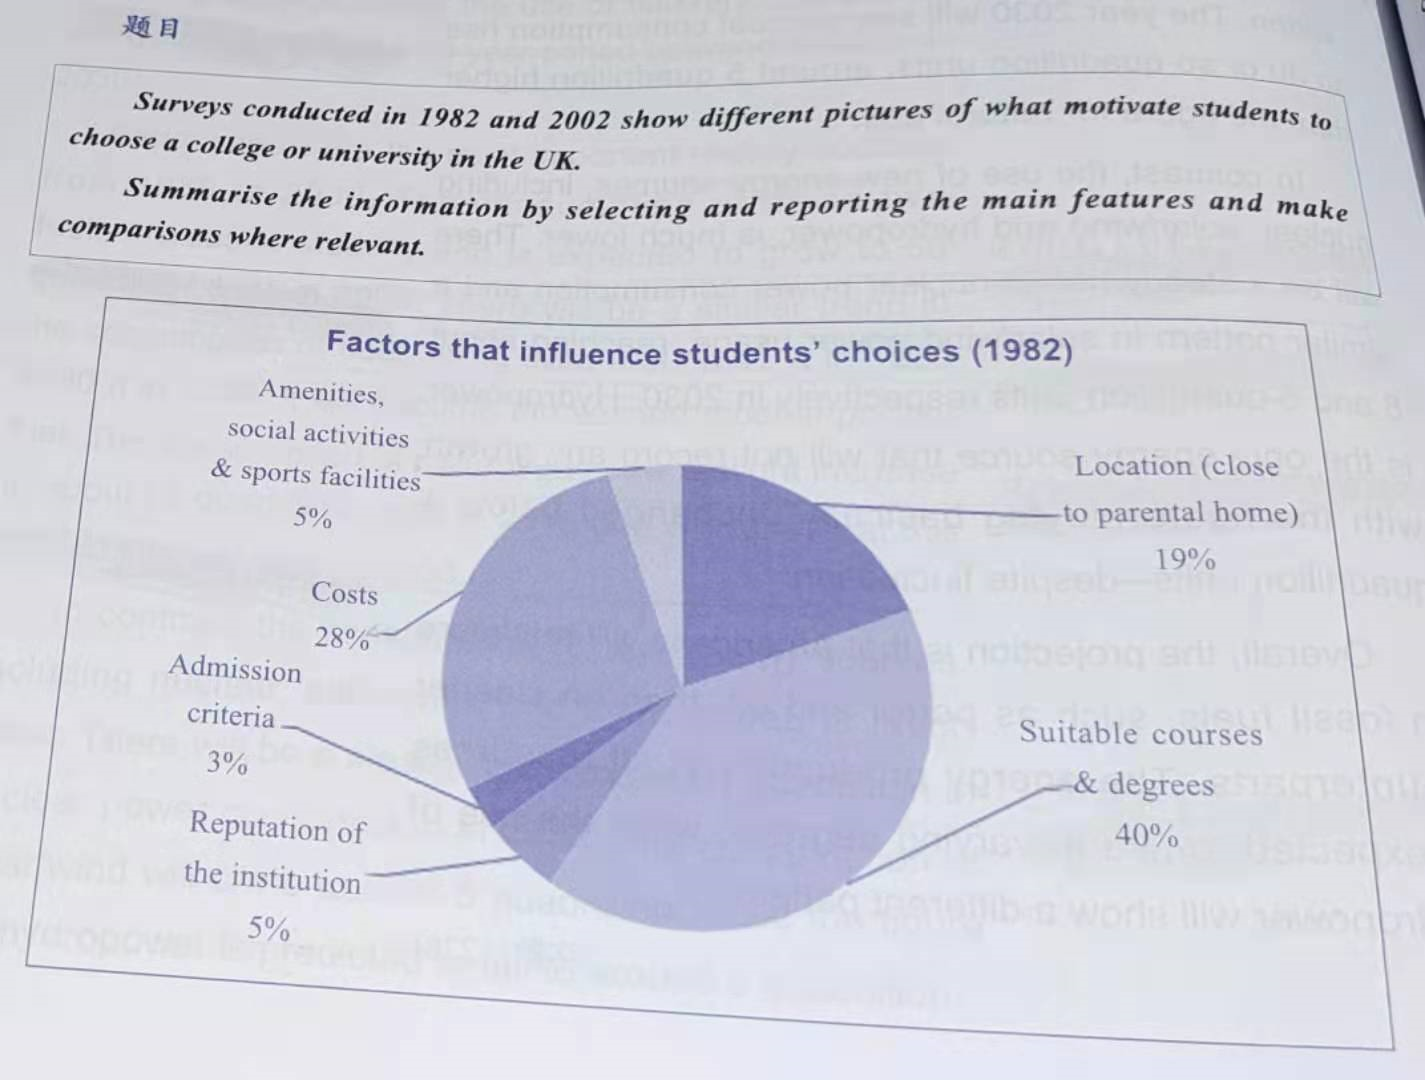
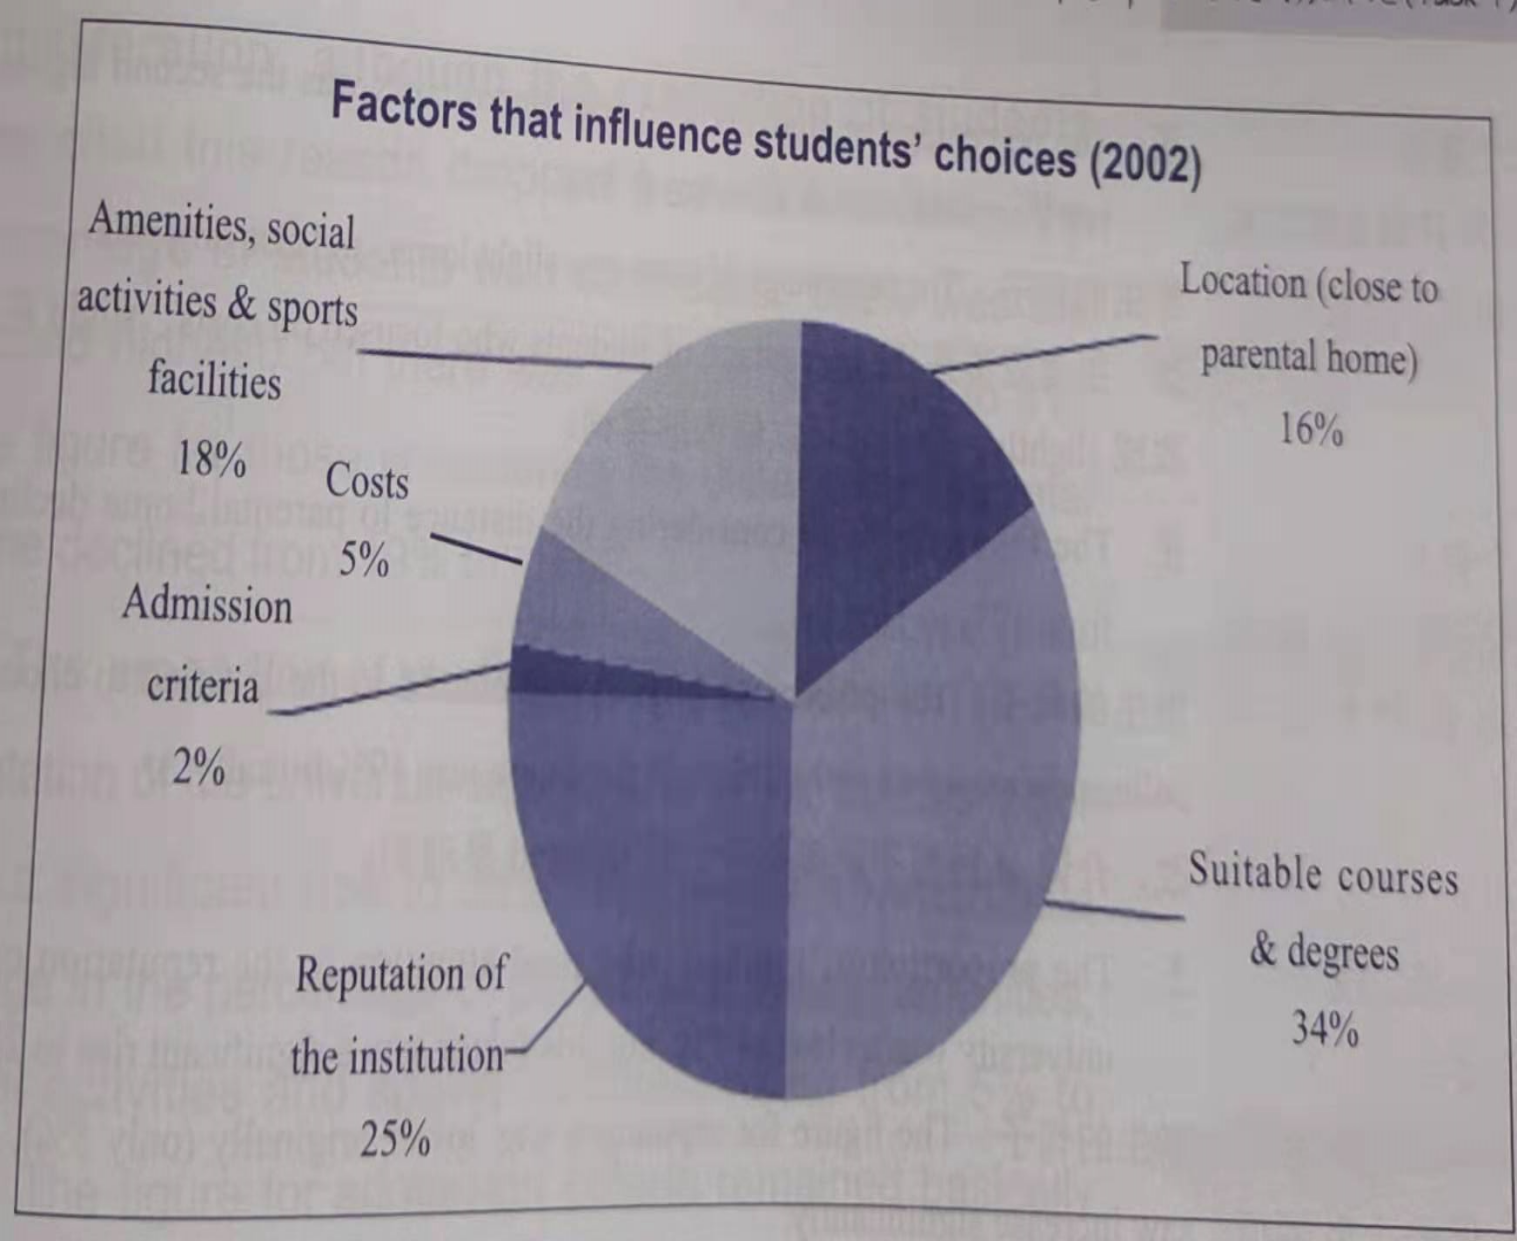
图形解析:两幅图展示的是英国1982年和2002年影响学生选择大学的因素,其中下降的有suitable courses& degree, costs以及location;上升的有amenities, social activities & sports facilities, reputation of the institution, admission criteria几乎没变。
思路提示
1.时态:一般过去时
2.分段: 开头段(改写题目);
主体段1:三个下降的;
主体段2:两个上升的+一个几乎不变的;
总结段落:点出上升幅度最 大,总结出上升的和下降的
注意:该类小作文的主体段不要用年份分段,不好进行相关信息的对比
范文
The pie charts compare the factors that students considered when choosing a university in the UK in two different years.
开头段可用句型:The chart(s) compare(s)...
Given is the graph which describes...
Suitable courses and degrees were the most popular consideration, although the proportion of students who cited this reason dropped from 40% to 34%. The percentage of students who considered costs was the second highest, but there was a sharp decrease to 5%. The figure for those considering the distance to parental house declined from 19% to 16%.
The proportion of students who paid attention to the reputation of the university was as low as 5%, but this factor saw a significant rise to 25%. There was a remarkable change in the percentage of people who valued amenities, social activities and sports facilities, rising from 5% to 18%. The figure for admission criteria remained basically unchanged(3% in 1982 and 2% in 2002).
主体段解读:两个主体段长短句交叉,用到了定语从句,状语从句,同时还使用了分词做状语,句型非常多样化,加分句型和词组有:the proportion/percentage of, see a significant rise in, there was a remarkable change in...
Overall,more students considered suitable courses and degrees than those who focused on any other factor. The percentages of students who considered fame of the university or amenities and sports facilities increased, while the figure for other factors showed opposing trends.
结尾段解读:跟静态图一样,点出了两个图的最关键的信息同时也概括了其他几个要素的特点。
动态图和静态图的区别主要体现在主体段落,动态图通常按趋势(如上升下降来分段),静态图通常按“多”“少”来分。