线图开启困难模式后,你还会写么?
今天的主题是“线形图”。线形图开启“困难模式”后,你还会写嘛?
2019年5月18日雅思小作文真题
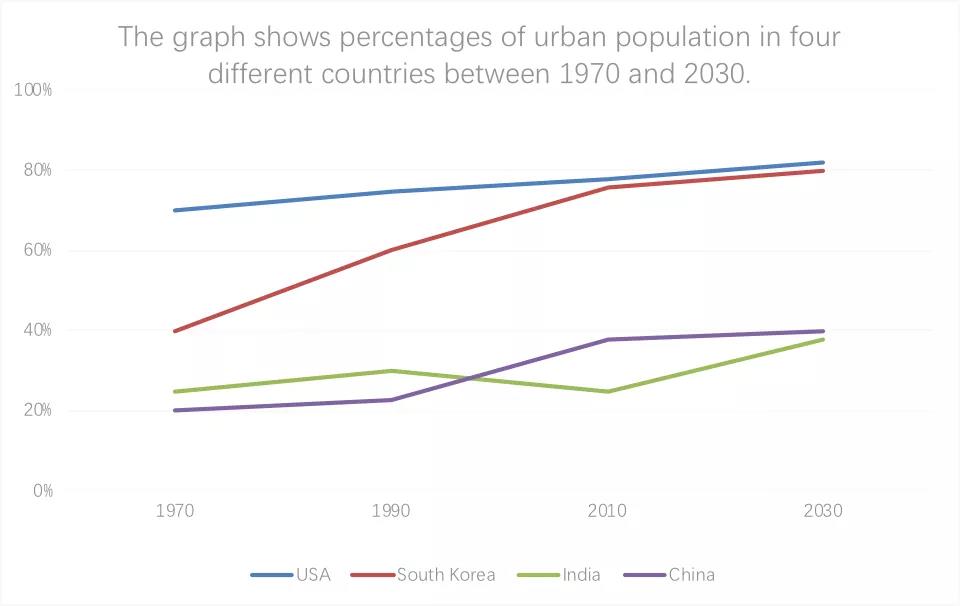
The graph shows percentages of urban population in four different countries between 1970 and 2030.
Summarise the information by selecting and reporting the main features,and make comparisons where relevant.

我们以2019年5月18日的真题为例,讲解线图的困难模式(一种):时间线从过去延伸至将来。
非常可能用到的一个时态:现在完成时(覆盖过去到现在)。
高分范文及解析
Introduction
The lines are the illustrations of the percentages of urban population in four countries,which are the US,South Korea,India,and China,since 1970,and the projections for the future until 2030.←不要照抄题目里的时间表述,而是带入时态概念重新表述。
Body
America'urban population has since 1970 been←现在完成时覆盖自1970年至今at a high level(70 percent to 80 percent)in terms of its proportion to the nation’s total population,and the proportion has been←现在完成时覆盖自1970年至今larger than the ones in the other countries.The slow growth is projected to continue until 2030.In South Korea,growing fast,the proportion caught up with America’s level in 2010 and has since been←现在完成时覆盖自1970年至今almost the same as it.The high similarity is predicted to remain until 2030.
India and China have had←现在完成时覆盖自1970年至今lower percentages of urban population than the United States and South Korea.用时间作为主语:The years since 1970 have seen unstable percentages of urban population in India,后接从句,表述细节情况:which fluctuated between 20 percent and 30 percent.In China,the growth has been at varying rates and reached 40 percent,and during the increase,the percentage of China’s urban population exceeded that of India’s.According to the forecast,China’s rate will stay at 40 percent,the point India’s rate is to reach←用同位语的方式说明China和India的关系.
整体说来,主体部分是“规矩”的写法:四条线逐个描述。
Conclusion
Overall,the history has witnessed vastly different rates of urban population between the four countries,and the future will see a high level of similarity between the US and South Korea and between India and China.
推荐阅读
- 9月28日雅思小作文真题高分范文!
- 雅思听力S4长笔记填空题怎么就这么难呀!
- 9月28日雅思大作文真题参考范文:父母和孩子间的年龄差增大优点VS缺点
- TED演讲:为什么你应该去做些无用的事?
- 写作必备:从英语名著中学习地道人物描写,值得细读!
- 拖延症患者最怕的话题:“时间管理”!
- 揭秘雅思听力三大常见陷阱
【本文标签】:
【责任编辑】:合肥新航道小编 版权所有:转载请注明出处


